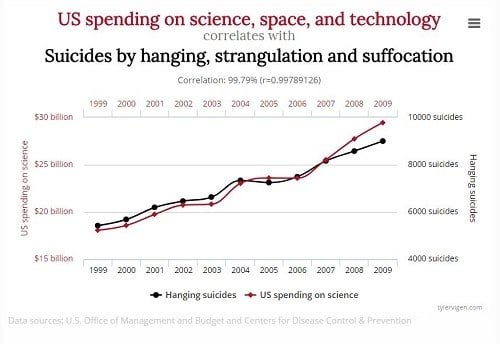
This is an example of reverse causality, which happen when we illogically infer causation from correlation. Often times, we mistakenly imply a strong correlation means causation. Let’s look at another example of this mistake. U.S. spending on science, space, and technology correlates with Suicides by hanging, strangulation and suffocation. [2]
Let’s start by looking at the definition of both correlation and causation. Correlation. In statistics, a correlation is a single number describing the degree of relationship between two variables. [3] The key word here is relationship, where a relationship may exist, but not causation. Causation. If A causes B we have direct causation. Meaning, one event is 100% causing something else. For example, if you stand in the rain, this will cause you to get wet.
Let’s look at another example, one that might initially confuse you (which demonstrates how easy it is to imply correlation equals causation). Does the following imply causation? Statement. If you commit a felony, you will go to jail. Answer. This does not infer causation, because you might go to jail if you get caught. Even if you get caught, you could still receive probation or a lesser punishment. Essentially, we can’t say for sure that committing a felony will cause you to go to jail. [4]
To avoid falling into this trap, peel back the layers.
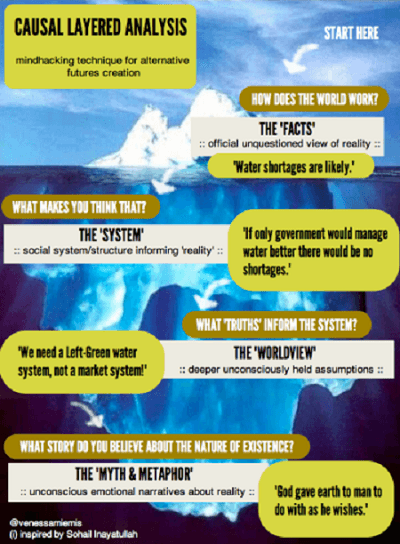
We can use a futures research method that will help us focus on an in-depth analysis of our problem. This method is called Causal Layer Analysis (CLA) and allows us to dig into the layers (or dimensions) of a problem. Let’s see how it works. [5]
There are four layers of CLA
Layer #1 – Litany. This is our day-to-day future where solutions to problems are typically short term. Layer #2 – Systemic Causes. Here we focus on the social, economic, and political issues. Layer #3 – Worldview. This is our big picture paradigm. Layer #4 – Myth or Metaphor. Our deep unconscious stories reside in this layer.
Using CLA will assist us in getting to the root cause of a problem. Go back to our U.S. spending and Suicide example. Instead of implying causation, we should dig into the root cause of this issue. This example shows a strong correlation, where r = .99. The closer we are to 1, the stronger the correlation. However, we know this is not logical. So, we must gather more data associated to this problem, identify other potential causes, and identify the true root of the problem.
Let’s look at some techniques we can use for this.
1. Fishbone Diagram
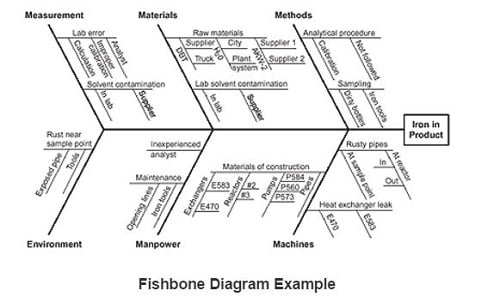
The Fishbone Diagram (otherwise known as an Ishikawa or Cause-and-Effect Diagram) is a way to identify as many possible causes for an effect or problem. [6]
2. 5-Why
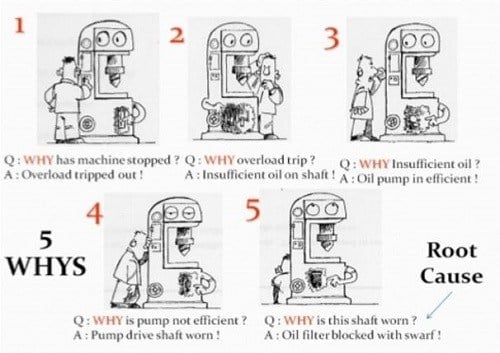
Here is a technique you mastered when you were a child, yet you forgot when you became an adult. Simply ask why. The 5-Why technique is a powerful tool allowing us to peel back the layers of symptoms and get to the root of the problem. [7]
3. Apollo Root Cause Analysis
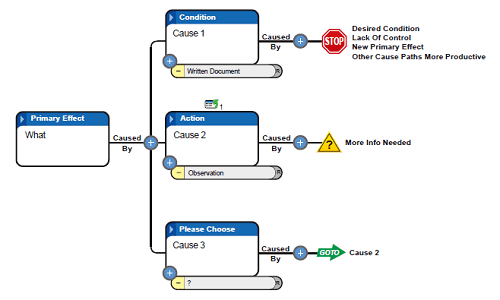
This is a way to dig deeper into root cause analysis. Here we look for (at least) two causes in the form of an action and condition, then ask why of each answer and continue to ask why of each cause until there are no more answers. [8]
4. Pareto Analysis
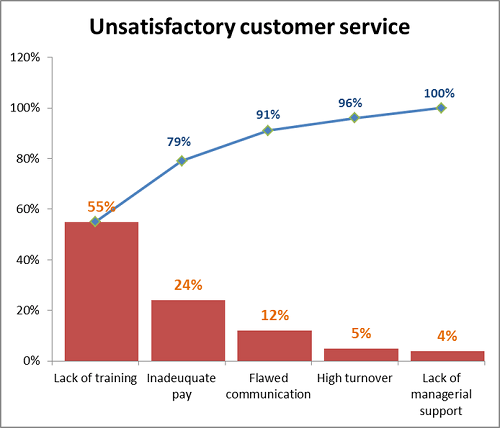
The Pareto analysis is where we use the Pareto principle. Here we find that 20% of our work creates 80% of the results… or 80% of our problem comes from 20% of a certain population. This is a powerful and effective technique for quickly identifying a problem area to focus on.
Can you now see the error when implying correlation equals causation? Once we understand how errors like this occur, we can use powerful techniques to expose them and find the true root cause to the problem. We are blind when we fail to do this. It’s like trying to look into a forest, but you are blinded by the trees; where you know there is a forest in there somewhere. Featured photo credit: Stocksnap via stocksnap.io
